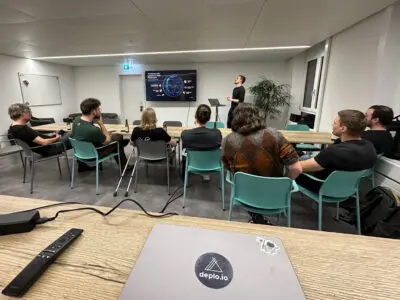
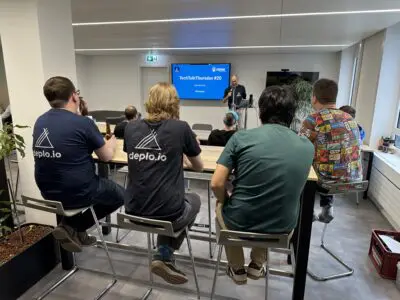
Looking Back on Our TechTalkThursday #23
The first TechTalkThursday in 2025 – and number 23 of the event…
Our team expertly configures, manages, and integrates the powerful solutions of Cloudflare into your Nine…

You would like to successfully run your website and application without worrying about managing your…

We don’t just manage your Kubernetes cluster, we provide a fully maintained open-source software stack…

As a future-oriented app engine, we simplify the use and management of your web applications.…

Using our Root Dedicated Servers, you benefit from our powerful infrastructure on two independent sites…

Virtual clusters have their own API server, which makes them much more powerful and better…

The first TechTalkThursday in 2025 – and number 23 of the event series – took…

Our TechTalkThursday #22 took place on the 5th of Dezember 2024 at 6PM in our…

With the first snow, we were enticed by the mountains: Our coworking retreat took place…

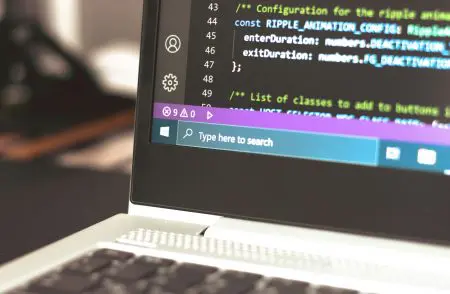
Web development has evolved significantly, with numerous tools and frameworks streamlining the coding process. However,…

Every company wants its products and services to be seen. This requires a marketing professional…

In today’s rapidly evolving tech landscape, modern systems like Kubernetes are often seen as the…

We supported Peak Privacy in designing and building a specialized server infrastructure for LLM inference.…

We helped Renuo AG to smoothly transition everything that was running on Heroku to Deploio,…

We helped mühlemann+popp to smoothly realise the migration from the Google Cloud to the Nine…

We supported healthinal with the implementation of a new monitoring system based on Managed Kubernetes.…

We have been instrumental in helping cab to implement an outstanding hosting solution that offers…

We helped Stadler Form to find the right technical solution. At the same time, there…
We'd like to provide you with regular information, news, background reports and recommendations about new technologies, market trends in cloud computing and IT infrastructures, product innovations and our company.
The first TechTalkThursday in 2025 – and number 23 of the event…
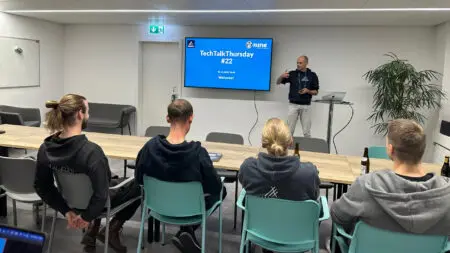
Our TechTalkThursday #22 took place on the 5th of Dezember 2024 at…
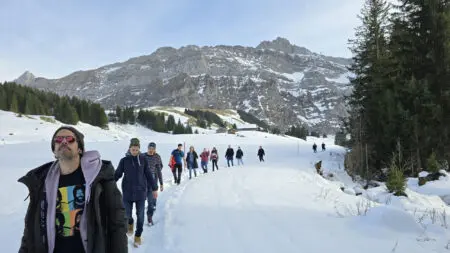
With the first snow, we were enticed by the mountains: Our coworking…
Web development has evolved significantly, with numerous tools and frameworks streamlining the…
Every company wants its products and services to be seen. This requires…

In today’s rapidly evolving tech landscape, modern systems like Kubernetes are often…
At Nine, we’ve been hard at work refining Deploio, our platform for…
Every company needs someone with a flair for numbers. An expert who…
Our on-demand MySQL and PostgreSQL databases are now available for your production…
Our TechTalkThursday #20 took place on the 2nd of May 2024 at…
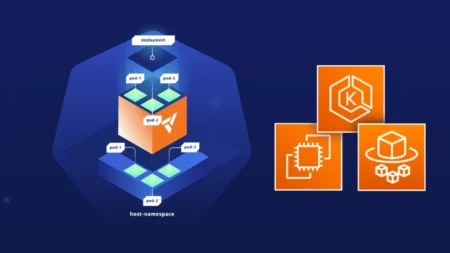
A virtual cluster is a fully working Kubernetes cluster that runs on…
In today’s web applications, search functions are omnipresent. Searching for product titles…
Do you have any questions about our products? Either contact Sales or go directly to your cockpit to see all the possibilities at Nine.
