
After having previously introduced our new monitoring system Prometheus in this blog, which replaced our legacy Nagios installation, I would like to dive a bit deeper into the technical details of our implementation in this article. First, I would like to explain the different sources for Prometheus metrics and specifically the “Node Textfile Collector” as a flexible solution for creating simple metrics.
Then, using a practical example I will show how an existing Nagios NRPE script can be modified so that it can be used to generate Prometheus metrics.
Prometheus Sources
Our Prometheus monitoring servers obtain their metrics directly from the systems being monitored. These metrics are made available to the monitoring server via an HTTP interface. There are several ways to obtain Prometheus-compatible metrics from an application:
In the simplest case, an application such as RabbitMQ (from version 3.8.0) or Traefik provides Prometheus-compatible metrics itself.
If the application to be monitored does not generate its own metrics, they can be created using a separate Prometheus exporter. The exporter communicates with the respective application and creates Prometheus-compatible metrics from its performance values, which the monitoring server can then query via an HTTP request on the respective exporter port. Ready-to-use Prometheus exporters are available for a large number of applications.
If there is no ready-made exporter for the specific purpose, it is possible to write your own exporter. However, the implementation of an exporter is a relatively large effort, especially for easy-to-generate metrics. If the metrics do not need to be updated in real time, a text file collector for the node exporter is a reasonable alternative.
Textfile Collector Scripts for the Node Exporter
The Prometheus Node Exporter provides basic hardware and operating system metrics, and it is therefore installed on each of our managed servers by default. In addition to the existing metrics, it offers the possibility to include self-created, Prometheus formatted metrics from text files in its query responses via the integrated Textfile Collector. How these text files are created is irrelevant, so any kind of script can be used. The script merely needs to be run regularly via a cronjob in order to update the metrics. A shell script, for example, can be used for this purpose, and it is only important that the script outputs the generated metrics in the appropriate format.
When we replaced our Nagios monitoring, an important requirement was to keep all existing individually developed Nagios checks available in Prometheus. These are mainly checks that are only used on individual machines or on internal infrastructure. In this case we could easily migrate the existing checks to our new monitoring system by using Textfile Collector scripts.
In addition, new checks that were not previously included in our Nagios monitoring can be implemented quickly and easily in this way.
A simple Textfile Collector script
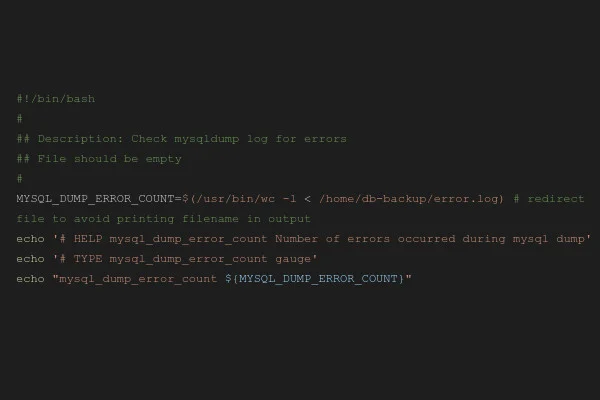
The following is a simple example of a custom metric created by a Textfile Collector script:
#!/bin/bash
#
## Description: Check mysqldump log for errors
## File should be empty
#
MYSQL_DUMP_ERROR_COUNT=$(/usr/bin/wc -l < /home/db-backup/error.log) # redirect file to avoid printing filename in output
echo '# HELP mysql_dump_error_count Number of errors occurred during mysql dump'
echo '# TYPE mysql_dump_error_count gauge'
echo "mysql_dump_error_count ${MYSQL_DUMP_ERROR_COUNT}"
Prior to the actual nightly backup, a MySQL dump is created on our managed servers in order to maintain a consistent backup of the databases. Even without extensive scripting knowledge, it is easy to see what the above shell script does: It checks the contents of the file /home/db-backup/error.log where errors are logged regarding the SQL dump and outputs the number of lines of the log file as the metric “mysql_dump_error_count”.
Ideally, i.e. with an empty error.log file, the script produces the following output when called:
root@host:~# /usr/local/bin/node_exporter_textfile_collector/mysql_backup.sh
# HELP mysql_dump_error_count Number of errors occurred during mysql dump
# TYPE mysql_dump_error_count gauge
mysql_dump_error_count 0
root@host:~#
In addition to the metric itself, an explanation of the metric and its type (in this case “gauge”) is defined as a comment. More information about the four different types of Prometheus metrics can be found here.
A cronjob calls the script every morning after the backups have been completed and writes the output to a file. That file is read by the node exporter and those metrics are returned to the monitoring server when it requests them. For alerting we only need a suitable rule on the monitoring server side which defines when an alert should be triggered:
 - alert: MySQLDumpError
    expr: mysql_dump_error_count > 0
    for: 5m
    labels:
      severity: warning
    annotations:
      summary: "There is an error with mysqldumps on "
      description: "Detected an error during mysqldump - see /home/db-backup/error.log"
Alerting rules are created according to a fixed syntax and evaluate a specific expression. In our case, a warning is generated for each value of the metric greater than 0 (mysql_dump_error_count > 0), as this indicates error messages in the log file.
Textfile Collector usage for advanced users: Recycling a Nagios script for SSL expiry monitoring
Finally, a nice practical example on the subject of SSL certificates:
We are already monitoring certificate expiration dates in order to be able to take care of their renewal in time. All certificates in the path /etc/ssl/certs whose file names begin with SSL_ are included in the monitoring. For the migration of the check to Prometheus the following options were considered:
- The use of an existing SSL Certificate Exporter, for example this one: This idea was discarded, since it monitors certificates externally via a TLS connection, which is in contrast to our previous solution. This would have the disadvantage that certain certificates cannot be verified from the outside, e.g. if they are used by an application that is only accessible internally.
- Writing our own exporter: This would not be practical as the effort is too great in relation to the required metrics (actually only days until the expiry and validity of the chain). Updating the metrics in real time is also unnecessary for our use case.
- Creating a Textfile Collector script: In this case the simplest solution, and as such, this approach was chosen.
But there is an even easier way: Why create a script from scratch when this task is currently already done by Nagios via NRPE script? Wouldn’t it be easier to adapt the existing script to the new requirements? Let’s take a closer look at the relevant part of the existing Ruby based Nagios script:
#!/usr/bin/env ruby2.5
...
ssl_certificates = options[:glob_path].map { |g| Dir.glob(g) }.flatten.delete_if { |f| f =~ /(\.chain\.crt|\.csr)$/ }

ok_certs = []
warning_certs = []
critical_certs = []

ssl_certificates.each do |cert_path|
  raw = File.read cert_path
  certificate = OpenSSL::X509::Certificate.new raw

 warning_state_at = certificate.not_after - options[:warning]
  critical_state_at = certificate.not_after - options[:critical]

 if Time.now >= warning_state_at
    if Time.now >= critical_state_at
      critical_certs << "#{cert_path} expires in #{(certificate.not_after-Time.now).to_i.seconds_to_days} days"
    else
      warning_certs << "#{cert_path} expires in #{(certificate.not_after-Time.now).to_i.seconds_to_days} days"
    end
  else
   ok_certs << "#{File.basename cert_path} (#{certificate.not_after.strftime('%Y-%m-%d')})"
  end
end

case
  when critical_certs.any?
    print_message(critical_certs, :critical)
    exit_code = 2
  when warning_certs.any?
    print_message(warning_certs, :warning)
    exit_code = 1
  else
    print_message(ok_certs, :ok)
    exit_code = 0
end

exit exit_code
The script basically already does what we need: It checks the expiry date of the certificate and calculates the number of days the certificate is still valid.
Additionally, the script includes logic that determines whether a certificate’s status should be OK, Warning, or Critical. We no longer need this logic for Prometheus as the evaluation of whether a warning or an alarm should be triggered is now determined by a rule on the monitoring server, as described above.
Instead, the script itself should only return the number of days until the certificate expires in the appropriate format. After reworking, the code snippet looks like this:
ssl_certificates = options[:glob_path].map { |g| Dir.glob(g) }.flatten.delete_if { |f| f =~ /(\.chain\.crt|\.csr)$/ }

cert_days_left = []

ssl_certificates.each do |cert_path|
  raw = File.read cert_path
  certificate = OpenSSL::X509::Certificate.new raw

cert_days_left << "ssl_certificate_days_left{certfile=\"#{File.basename cert_path}\", certpath=\"#{cert_path}\"} #{(certificate.not_after-Time.now).to_i.seconds_to_days}"

end

puts "# HELP ssl_certificate_days_left Days until certificate expiry\n# TYPE ssl_certificate_days_left gauge"
puts cert_days_left.join("\n")

exit_code = 0

exit exit_code
Since the largest part of the logic has been omitted, the script has become significantly shorter. Its output now looks like this:
root@host:~ # /usr/local/bin/node_exporter_textfile_collector/x509_expiry.rb
# HELP ssl_certificate_days_left Days until certificate expiry
# TYPE ssl_certificate_days_left gauge
ssl_certificate_days_left{certfile="SSL_wildcard.nine.ch.crt", certpath="/etc/ssl/certs/SSL_wildcard.nine.ch.crt"} 672
root@host:~ #
Finished! The script now returns the remaining validity period in days for all certificates as a metric. In reality, of course, changes also had to be made to the option parser, as well as in other places, however most of the work has already been done at this point. Compared to creating a new script, this simple adjustment saved us significant effort.